
|
|||||||||||||||||||||||||||||||||||||||||||||||||||||||||||||||||||||||||||||||||||||||||||||||||||||||||||||||||||||||||||||||||||||||||||||||||||||||||||||||||||||||||||||||||||||||||||||||||
|
|||||||||||||||||||||||||||||||||||||||||||||||||||||||||||||||||||||||||||||||||||||||||||||||||||||||||||||||||||||||||||||||||||||||||||||||||||||||||||||||||||||||||||||||||||||||||||||||||
|
Frequently Asked Questions
These are answers to frequently asked questions related to MR-ML™ Technology. They are grouped by main topics: instrumentation, algorithm (inversion/fitting), software, measurement and data interpretation. 1.1 Instrumentation related questionsQ: What is the difference between ‘high field’ NMR and ‘low field’ NMR? Typical NMR/MRI (magnetic resonance imaging) analytical or/and imaging tools work at possibly higher magnetic field (which means higher frequency that is related to the magnetic field intensity via gyro-magnetic ratio of a nucleus). This is done in order to gain sensitivity and spatial resolution (sensitivity is roughly proportional to the second power of frequency). The frequency range for hydrogen is normally 20-200 MHz (imaging, high resolution spectroscopy). In the case of our MR-ML ™ Technology the frequency range is 1-5 MHz. We call it low field (frequency) just for unusually low field (frequency) range. Why do we use low field NMR? One reason is low cost, low weight etc implementation but still with sufficient sensitivity for proton relaxation measurement on the sample volumes typically used. Two more reasons are specific for porous media application characterization in rock formations. First, in order to support interpretation of NMR well logging data, the operating frequency of a relaxometer should be in the same range as in logging instrument. The magnetic field in a well logging instrument is limited to achievable for an inside-out sensor magnetic field intensities corresponding to frequency 1-2 MHz. Second, higher magnetic field generates stronger random internal magnetic field gradients due to magnetic susceptibility contrast between rock matrix and fluids. This may introduce additional uncertainty in data interpretation. Q: (a) Is the magnetic field of the instrument homogeneous? (b) Can the instrument measure T1 and diffusion coefficient? (a) Yes, the magnetic field is homogeneous. Inhomogeneity of the magnetic field is less 1% in a cylinder 4 cm diameter and 4 cm length. Size of this cylinder is the “sweet spot” size. The volume of the sweet spot is about 23-24 ml. (b) No. Inhomogeneous (gradient field) required for diffusion measurements has not been implemented. The feature can be delivered upon request for an additional charge. Q: The standard sample CuSO4 decays within 2 weeks. Why do you use it as a standard? We don’t have any experience with decaying the standard. We used CuSO4 (doped water) as standard sample. The solution decays when it is in a contact with a metal. Standard sample for our system is sealed in glass vial with the volume of 21-22 ml. Q: How does the outside temperature variations influence the magnet used in the instrument? During the instrument operation, the temperature variations cause changes in the magnetic field of the magnet with the rate of 0.04% per 1 ° C. The calibration procedure takes care of the changes by adjusting the operating frequency. The system can handle approximately +/- 10 ° C ambient temperature changes. Q: Low temperature environment causes losing magnetization properties of magnets. How do you solve the problem for MR-ML™ system’s magnet? Relevant consideration for the temperature effect during transportation would be whether or not the magnet experiences an irreversible loss of magnetization (correspondingly, the magnetic field intensity). The magnet used in MR-ML™ system uses a high energy sintered SmCo-type material. There is no irreversible losses of magnetization should be expected at all in the temperature range from Do not confuse this magnet with non-conductive ferrite-type magnet that is used by NUMAR. It has positive temperature coefficient of coercive force, and therefore irreversible loss is part of its magnetization at low temperatures. 1.2 Algorithm related questionsQ: What inversion/fitting algorithm is used in the data processing software? The system uses an inversion algorithm to display the spectrum after the NMR relaxation curve has been registered by the spectrometer. This is multi-exponential decompositions method, based on non-negative least square algorithms. It is available in most of the mathematic libraries (FORTRAN, Mat lab and C). If it is necessary the software can be upgraded with continuous distribution and cumulative curves can be displayed as well. 1.3 Software related questionsQ: Before the data processing and interpretation, do users have to spend a lot of time to create spectra database based on their own geology environment for the interpretation? No, but if you have some specifics, related to the mineralogical composition of your sediments (paramagnetics, magnetic minerals etc) then you have to provide fine tuning of interpretive models for interpretation (petrophysical) part of the software. Q: Can KMS Technologies provide the software structure and detailed user manual? Yes, we provide our users with printed out and electronic version of user’s manual. The software also has help features built in. Q: Will KMS Technologies provide software maintenance and upgrade to users? How long KMS can provide the software maintenance and upgrade services to users? Software upgrades are included in the purchase price for a period of one year. Subsequently software and hardware maintenance and telephone support will be 11% of purchase price per annum. An y upgrades related to specific customer goals and related to the unusual situation with petrophysical interpretation can be handled as a separate special service contract. 1.4 NMR measurement and interpretation related questionsQ: (a) Can CuSO4 solutions that we use to saturate the core plugs and cutting samples for NMR measurement damage the core or cutting samples. (b) Can we use the alcohol or kerosene to saturate the cutting sample for the NMR measurement? (a) We do not saturate the sample with CuSO4. This solution is used for standard sample preparation. We have experience with saturation procedures (thousands of samples) and we did not observe damaged samples during our experiments. Samples will not be destroyed or damaged by CaCl2 solution (15 g per liter and more). This solution will prevent samples containing smectites from swelling. Samples containing smectites (montmorillonites) can be destroyed by brine with low salinity and must be saturated by brine with higher salinity (for example, 325 g NaCl per liter). Better saturation will be carried out with natural brine or with proper simulated natural brine solution. (b) Kerosene is a solvent and will totally change the wettability conditions of pore surface and therefore distribution of irreducible/residual fluids in porous. DO NOT USE KEROSENE. The hydrocarbon properties will be extremely influenced and changed as well. If you would like to use this liquid only for routine measurement of the filtration capacity properties (porosity, permeability, Swirr), we can do tuning of our models and prepare specific interpretive means in our software. Similar results are obtained with alcohol. But you have to provide us with collection of samples that will be used for these specific jobs/purposes. We have no samples that we are permeated to treat by this saturation procedure. Q: Can we use decane to saturate our cuttings since NaCl solution dissolves them? Should we use decane as a standard sample as well in this case? Yes, but residual oil distribution in porous media and pore surface wettability can be changed. Q: What are the equations for porosity, permeability and irreducible water saturation evaluation? A producible porosity or effective porosity is called free fluid index (FFI). For shaly sands, effective porosity is fractional volume of a formation occupied by only fluids that are not bound and whose hydrogen indexes HI (the ratio of the number of hydrogen atoms per unit volume of a material to the number of hydrogen atoms of pure water at equal temperature and pressure) are 1. Producible fluids reside in large pores while the bulk volume irreducible (BVI) reside in small pores. The total porosity Φ is then Φ = FFI + BVI . A T2 value that separate “small” and “large” pores is called T2cutoff and for the sandstones it has been experimentally established to be around 30 ms (see Fig. 1). The FFI is calculated by integrating distribution spectrum from T2cutoffto T2max and BVI is estimated as an integral over the spectrum distribution within the limits between T 2min and T 2cutoff.
According to Coates Free Fluid Model (FFM) a permeability k can be estimated as
The coefficient C is a variable that is dependent on the processes that created formation and can be different for each formation. It has to be customized through core calibration for different formations and reservoirs. The interpretation model for NMR PERM estimates is called MR-ML™ model: NMR PERM= ¦ (Øeff, PSD, GSA) , Where Øeff is the effective porosity, PSD – pore size distribution, GSA – results of grain size analysis. The model is for permeability determination of the samples in six clusters. The classification of the clastics (six clusters) can be found in Khanin (1976). The solutions for MR-ML™ model was found as LgPERM=a* Øeff + b. The coefficients a and b were found for each cluster. Principals/criteria for Øeff determinations were developed using a generalized NMR parameters (T2 spectra) for each cluster. For more detailed explanation, please see an article: Mirotchnik, K., Kryuchkov, S., and Strack, K. M., 2004, A novel method to determine NMR petrophysical parameters from drill cuttings, SPWLA 45th Annual Logging Symposium. Q: Can MR-ML™ system measure the filtration parameters on carbonate core plugs? Filtration Capacity Properties (porosity, permeability etc.) of carbonate reservoirs are significantly dependent on results of diagenesis (secondary porosity). This kind of information usually is not presented in drill cuttings with particles size less than 6.35 mm and in this case cannot be measured by MR-ML™ System. Regarding carbonate core plugs we have some experience on measuring NMR signal and petrophysical interpretation with MR-ML™ systemwith promising results but they are under un-disclosure agreement. The current version of MR-ML™ system does not include any models for carbonate samples. Q: How close of the porosity and permeability of fractured carbonate reservoir derived from MR-ML TM system to the laboratory measured value? Do we have special requirement to such carbonate cutting samples? See answer to previous question. Q: Apart from the two successful examples described in the technical notes, can KMS Technologies provide more detailed and comprehensive summary of all the successful application examples? No other released examples are available at the moment (lots of unreleased though). Q: Can MR-ML™ system calculated petrophysical parameters on gas-saturated cuttings samples? The current version of MR-RL™ system can measure the porosity and permeability of most rock samples (core plugs and cuttings) except of carbonate samples. If any rock cutting samples from the gas reservoir have been selected and prepared according to the sample preparation procedures, the MR-ML™ system should be able to measure their porosity and permeability. The gas content in these samples has escaped after they came to the surface and cleaned. As long as we can fully saturate these samples with CaCl 2 brine (or formation artificial compatible brine), the MR-ML™ system will be able to determine the porosity and permeability of these samples. If the customer wants to measure the gas or hydrocarbon properties (in-situ measurement), the NMR measurement has to be performed on the fresh mud next to the wellhead (on site) to minimize the loss of gas or hydrocarbon while the drilling mud moves cuttings to the surface. Q: Cuttings from the PDC drill bit are usually very small, so it is very difficult to distinguish the actual cuttings from the reservoir formation. How to handle this problem? The technology provides reliable results only for cutting size S>1mm. Topology of the porous media can not be adequately presented on particle size S<1 mm with filtration radius R>20 microns. Q: If we do not select and separate the specific rock cutting samples from the mixed cuttings on the drilling site, can we measure the percentage of different rock cuttings from the mixed cutting samples? Does the software have such functionality? No, this system is only for petrophysical parameters determination. For determination of the percentage of different rock cuttings size you can use routine grain size analysis. For mineralogical analysis you can use portable XRD (X-ray diffraction) devices. We have solved the problem related to determination of clay and siltstone contents by NMR before. A similar custom R&D project is available upon request. Question was formulated non-properly: If we are talking about quantitative determination of mineralogical components then answer is OK. BUT, we have to understand what means: different rock cuttings. Actually we can predict with NMR relative amount of clay (for some type of shally sandstones) and more of it (in some specific cases) amount of clay and type of clay. Actually, mineralogical composition (quantitative results) is also petrophysical parameter. Q: (a) Do we collect the drilling mud sample at the wellhead? (b) Do we need to remove the sand from the drilling mud (remove cuttings by sieving the mud)? (c) Are we going to lose the gas component after vibrating sieve? (a) If you would like to investigate properties of the drilling mud during the drilling process (for example: stability of the mud quality) – yes, need to collect the drilling mud sample at the wellhead and use the MR-ML™ System. (b) Yes, you have to remove the sand from the drilling mud. (c) Yes, as usual you will lose the gas component after vibrating sieve. Q: When we measure the drilling mud sample, do we use the spectrum characterization to describe the different fluid and additives in the drilling mud? Can we quantify the different fluid and additives? If the additives have its unique NMR “mask” (signature/template/image-spectrum) you will be able to differentiate them by NMR measurements. If not, you can try solving the problem by appropriate mud treatment before NMR measurements (two or more runs procedure). As a minimum, we can separate signal from hydrocarbons and water. Ability to identify any other additives must be investigated separately. Q: Is it possible to measure NMR signal of fluid samples? Yes, there is a special function in the software to measure NMR signal on liquids. Q: (a) Can we use the MR-ML™ system to determine wettability? (b) Did you compare results of porosity/permeability evaluation on a core plug and cutting sample, derived from the core plug? (a) Yes, we can. (b) Transverse relaxation time (T 2 relaxation curves – RC) measurements were performed on core samples and cuttings of different sizes that were made from the same rocks. Both samples (cores and cuttings) had a water wet pore surface with Sw=100%. The difference in core samples and drilling cuttings structure with wide pores’ cross-sections range becomes more apparent under fully water-saturated conditions. The permeability and effective porosity of rocks with inter-granular porosity are generally dependent on the pores’ throats. The samples with identical filtration capacity properties (FCP) and NMR characteristics were grouped for the measurements. The following experimental program was carried out for solving above mentioned problem:
The petrophysical characteristics of samples are presented in Table 1a and 1b. Table 1a: Petrophysical parameters of samples (outcrops).
*/ T2mf – modal T2 values for main group of pores influenced on fluids dynamics in porous media (Rf≥5μм) @ Sw=100%. Table 1b: Petrophysical parameters of investigated set samples.
The differential T2 spectra from some investigated samples are presented in Figure 2. T2 cumulative curves are presented in Figure 3. The cumulative curves were used for samples grouping and for calculation of the errors in the spectrum using multi-exponential analysis.
The pore distributions (Rf) affecting fluid flow in samples are in Table 2. Table 2: Results of FCP determination on investigated set of outcrop samples.
Where a (%) – percentage from pore volume presented by pores with Rf_j.
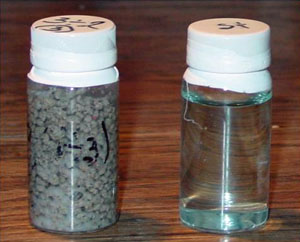
Q: What kind of fluid permeability (absolute, gas, oil or water) did you use to compare NMR permeability Gas permeability and water permeability. Water permeability data are more reliable (in water wet porous media), because we are working with the same studied object: H2 in porous media. Q: Why weight of each sample must be ~ 50 g at sandstone density? The shape of the container (glass vial) used for cutting sample storing has to be similar to that of standard sample. Volume of cuttings inside the container has to be close to volume of the standard sample, see figure 4 below.
Volume of the standard sample (doped water) is about 18-21 cc. So for a sandstone with density =2.65 g/cc we will need about 50g of rocks to have the same volume as filled vial. And still, signal from porous media will be significantly less than from signal from standard sample (porous media just % from whole volume), therefore S/N will be less than on S/N ratio obtained on standard. Q: Can MR-ML™ system distinguish the filtration parameters on cuttings drilled with Oil-Based Mud? If yes, what preparation procedures are required for the samples? Yes, it is possible. Generally, using Oil Based Mad (OBM) for drilling changes wettability of the penetrated rocks tremendously. Otherwise, if the properties of the mud are known: percentage of fluids and additives, hydrogen indexes, how NMR properties of the mud are different from NMR ones of saturating fluids; then a research project can be done to tune the software and develop a method for petrophysical parameters evaluation for rocks drilled on every particular OBM. Q: Reservoirs in parts of the world are drilled using drilling bits producing extremely fine cuttings ( so fine that at times the Well site Geologist cannot even see if they represent carbonates and he must send them to specialized labs). You mention a maximum sample size of 1.5 inch and core samples of 4cm x 5cm. What is the minimum cutting size, on which the measurement can be performed? Maximum size of plugs for measurements 2”x1.5”, minimum cutting size is 1 mm. Q: Considering that only the fluids are visible (can be measured) by the NMR, only the primary porosity shall be measured. The secondary porosity, i.e. vugs, fractures (often the most important reservoir porosity in carbonates) will not be measured, because are “lost” when the hole is drilled and cuttings brought to surface. Yes, non-represented object (big vuggy>20 μm and fractures) cannot be studied. Only cuttings with 3 mm can be used for micro-vuggy investigation (pore size bigger than 20 μm). But (answers) about wettability, residual oil content, matrix saturation etc. can be provided on cuttings with S=1mm. If a customer needs this information – we can provide palliative solution for it. Q: What kind of special procedures are required to prepare the cuttings for the NMR measurement? Considering the NMR sees only the fluids, the cuttings must be perfectly dry; otherwise the fluids attached to the cuttings will be seen as porosity. We provide our customers with detailed cutting sample preparation procedure. The rock particles are stored under NaCl brine. For petrophysical parameters calculation we exclude NMR signal from bulk water as non-informative signal elimination. Q: Drying extremely small cuttings will/may result in removing the fluids present inside the cuttings and associated with the porosity we want to measure. MR-ML™ System sample preparation procedure does not include drying cuttings surface. NMR measurements can be performed on fresh cuttings with water removed from its surface by blow it through with an air of on cutting sample when cuttings are stored covered with NaCl brine. Dry cuttings has to be saturated before NMR measurements. Q: We shall need cuttings large enough to contain fluids. Therefore what is minimum cutting size for MR-ML ™ Systemmeasurement? We propose to measure on 1 mm-6 mm cuttings. The optimization of the drilling program can be provided (different bits) for exploration wells where wide range of information is important. This job was done for offshore wells in the Gulf. Q: For all these reasons, we believe that measurement cannot be done on a single cutting, but a group / mass of cuttings. How to prepare this mass of cuttings NOT to affect the NMR true measurement. Of course, measurements on one piece of cuttings (depends on its size) is impossible (S/N>1). As it is said above for an informative measurement you will need a cuttings sample container with a volume close to standard sample volume filled with cuttings. We provide our customers with detailed sample preparation procedure. Q: The comparison between Archimedes porosity and NMR porosity starts at 17% porosity and upwards, meaning a rather large amount of fluid is required to get a valid measurement. If true, it is not very promising for measurements on very small cuttings. 3 mm cuttings size is enough to get this information. Q: The remark that “fully water saturated rock cuttings provide the most preferable conditions for evaluating permeability from NMR measurements” and “ the accuracy of the raw reported porosity is an issue for gas and light hydrocarbons” would be a limiting factor to market the NMR service on cuttings. Oil Companies are more inclined to spend money for oil/gas bearing reservoir evaluation than water bearing ones. This expression related to measurements on cuttings saturated with conventional oils (visc>20 cPs) and water or mud filtrate. Issue is hydrogen index of the saturating fluids (or amplitude index – Ai). Assumption is Ai water =Ai light hydrocarbons. In this case measurements can be provided properly. Heavy oil needs specific procedure for measurements and we are proficient with it as well. We did not presented these results in the referenced paper References
|
|||||||||||||||||||||||||||||||||||||||||||||||||||||||||||||||||||||||||||||||||||||||||||||||||||||||||||||||||||||||||||||||||||||||||||||||||||||||||||||||||||||||||||||||||||||||||||||||||
|
Visitors
@ Copyrights Reservoir Star International, Inc. 2003-2005 For problems or questions regarding this web contact webmaster@reservoirstar.com Last updated: 07/13/2005 |